


The Best Commodities to Hedge Inflation : "Commodities are a hedge against inflation!" We've all heard the advice—and if we say it often enough, then it must be true. But while commodities are a market most investors should have at least some exposure to, claiming the entire asset class will act as a strong inflation hedge is seriously misleading. But hey, I suppose it makes a nice little sound bite.
Of course, to some degree, commodities as a whole are a hedge against inflation, insofar as any useful thing will have some functional worth, regardless of the currency in which it's priced. But when it comes to inflation hedging, not all commodities are created equal.
So which commodity—or class of commodity—actually provides the best hedge against U.S. dollar inflation?
Hedging By The Numbers
To answer this question, I've selected a representative commodity from each of the most common categories—energy, softs, grains, metals, livestock and even lumber—and run a full regression analysis, comparing their daily prices with the U.S. dollar/Swiss franc exchange rate over the last five years (2005 - present).[1] (Why the USD/CHF exchange rate? Of all the possible currency pairs, I think USD/CHF acts as the best gauge of the worth of the U.S. dollar, given the stability of the Swiss economy, coupled with its rock-solid banking industry and high global economic standing.)
For the statistically un-inclined, "R_squared" is a measure of the extent to which the change in value of one factor can be explained by the change in value of another. In this case, it tells us how much of the returns for our representative commodities can be explained by their correlation to the dollar. (A negative correlation, by the way, implies that one factor goes up when the other declines, while a positive value means the two move in the same direction. No correlation means the values move independently of each other.)
One thing to keep in mind, however, is that both currencies and commodities tend to possess cyclical, time-series correlations. So you shouldn't take this analysis to mean that commodity x and commodity y are and will forever be correlated to the dollar by some set amount. Instead, this analysis should offer a general base of comparison between the commodities themselves.
Take a look at the results, and see for yourself which commodities truly do provide the best inflation hedge.
Energy
Representative: Crude Oil
Correlation Type: Negative
R_Squared: 0.3119

Surprised? So was I. Given the much-ballyhooed oil-dollar link, I fully expected the two to exhibit a much closer statistical relationship.
However, previous analyses I've done comparing oil prices to the dollar have revealed that the oil-dollar correlation has grown much stronger throughout 2008 and 2009 (which offered R_Squareds of .5692 and .8374, respectively). This may be due, at least in part, to a changing global economic climate; as emerging powers modernize, they are bound to consume more oil.
Therefore, although oil may not have been the best inflation hedge for most of the previous decade, as oil becomes a more important ingredient in the vitality of emerging economies, such as China and India, look for this relationship to strengthen.
Grains
Representative: Corn
Correlation Type: Negative
R_Squared: 0.5417

The most American of grains turns out to be a fairly reasonable hedge against inflation in the dollar. And since America grows most of the world's corn, that makes perfect sense.
One thing to keep in mind, however, is that corn's primary use the world over is in livestock feed. If American corn prices get too high or the dollar becomes too strong (or both), farmers in other nations would be happy to switch to a cheaper, non-American and/or noncorn-feed for their livestock, thereby decreasing world corn demand and inevitably, the value of a bushel of corn. So before going long corn to hedge the dollar, be sure to consider the fungible nature of feed grains.
Meats/Livestock
Representative: Pork Bellies
Correlation Type: Positive
R_Squared: 0. 2977

Note: Due to the unavailability of reliable prices, the sample size for pork bellies prices is somewhat smaller (8/29/06 - 1/21/2010).
Sure, pork bellies are perhaps not the first choice proxy for livestock in general, insofar as the market's open interest and volume are perpetually an order of magnitude below that of cattle. But come on, who doesn't like bacon?
As you can see, pork bellies are slightly positively correlated with the U.S. dollar. I pulled up the USDA's most recent WASDE report to get an idea of why this might be, and immediately found my answer: In 2009, United States farms produced an estimated 23.07 billion pounds of pork, exporting about 4.18 billion pounds while importing only 841 million. It seems the global pork market is not one in which the United States has any interest in participating; we like to keep our bacon right here in the good old US of A. (Although the hit pork exports took during last year's "swine flu" fiasco may have played a part in the low export numbers as well.)
So next time you order a BLT, feel free to cancel out your gluttony guilt by taking pride in supporting a home-grown industry. But just don't think about hedging inflation with a pork bellies contract.
Precious Metals
Representative: Gold
Correlation Type: Negative
R_Squared: 0.7357

As expected, gold and the dollar are inversely linked at the hip. Nothing particularly surprising here, as everyone and their mother knows that these two tend to move in opposite directions. The shiny metal is your textbook inflation hedge.
Non-Precious Metals
Representative: Copper
Correlation Type: Negative
R_Squared: 0.1039

Copper has been one of the major, if not the major, inputs in every industry in history, from the eponymous copper age (before alloying was invented) right up to the digital age. So the small correlation between the dollar and copper may come as a surprise.
Historically, copper prices rise as global industry expands and falls during global recessionary periods, so perhaps the lack of a serious correlation is the result of copper being too useful and abundant to provide any hedge whatsoever. Because the Earth is literally teeming with the stuff, we don't feel the need to melt it down into ingots and hoard it in vaults. Instead, if and when demand arises, it's easy enough to just dig it out of the ground.
Forest Products
Representative: Random-Length Lumber
Correlation Type: Positive
R_Squared: 0.3777
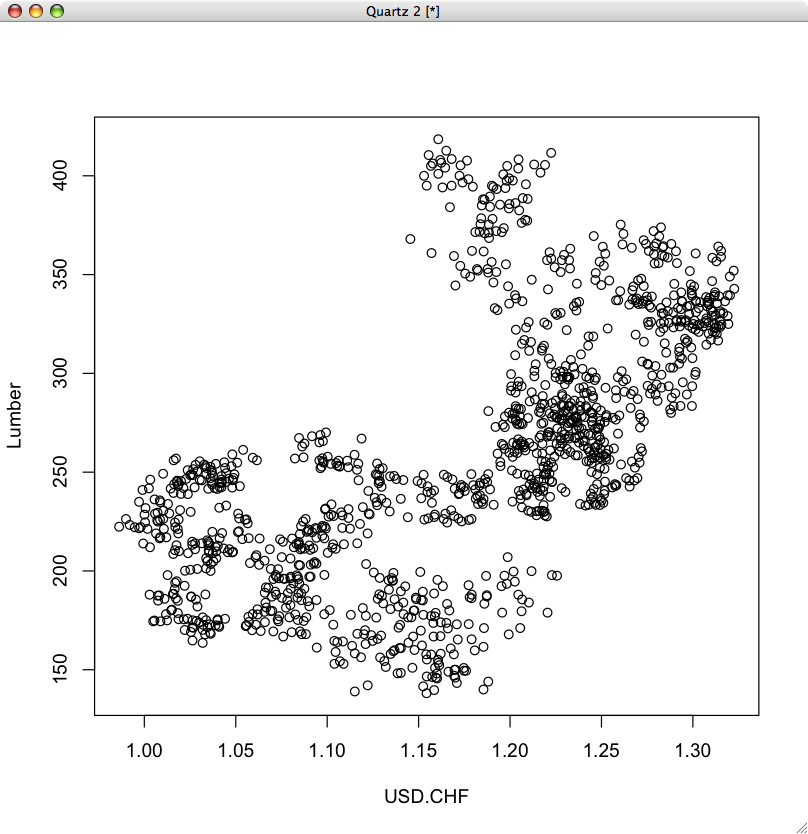
Like pork bellies, lumber is a largely internal market, in that the U.S. uses almost all the lumber it grows. However, because we also import so much of the stuff from Canada, it is better to think of lumber not as an exclusively U.S. market, but as a North American market.
In 2008, for example, the U.S. produced 29.18 billion board feet of lumber, while Canada produced 23.65 billion board feet, according to the Western Wood Products Association's Lumber Track Magazine. We exported only 295 million board feet to Canada, while importing 11.62 billion board feet from Canada—nearly half of the country's yearly production. At the same time, U.S. imports and exports from non-Canadian countries both remained low, at 1.06 billion board feet and 729 million board feet, respectively.
In that context, lumber would only make a good inflation hedge if the currency you're hedging has the queen on one side and a bird on the other.
Softs
Representative: Coffee
Correlation Type: Negative
R_Squared: 0.5469
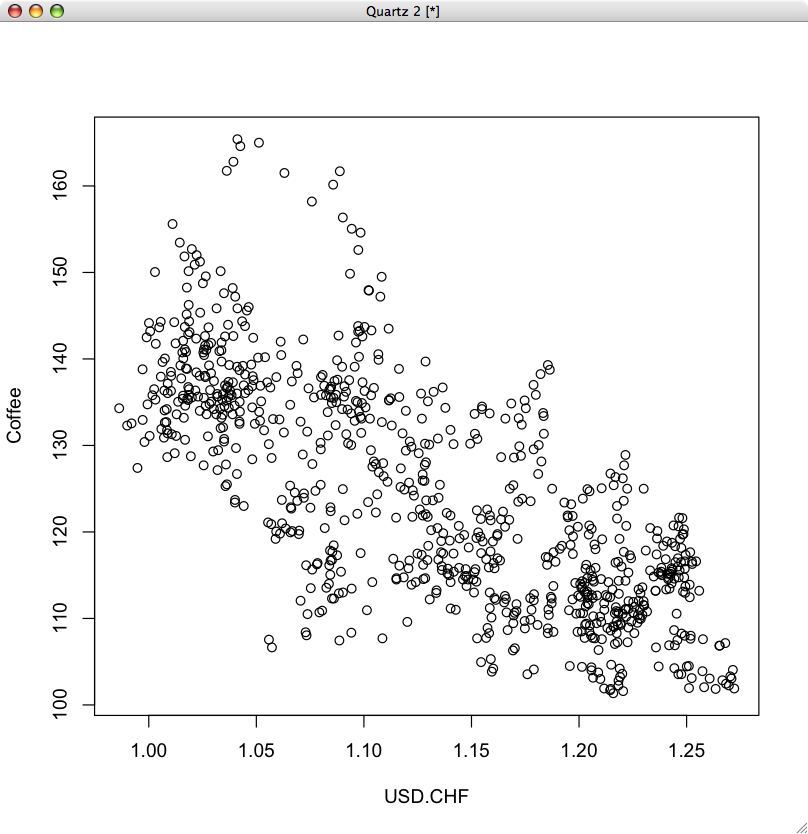
Note: Due to the unavailability of reliable prices, the sample size for coffee prices is somewhat smaller (9/19/06 - 1/21/2010).
Coffee is one of the world's most traded and active commodities; everyone everywhere drinks coffee every day, and it only grows in a few select regions. Its status as a truly global commodity with an active market is what makes it a reasonable hedge against dollar inflation. Coffee seems to be the one luxury that people won't give up, even when times get tough; the U.S. even included coffee in its relief supplies during the Berlin airlift. That should say something about the strength of our collective addiction.
As we can see, if your goal is to hedge against dollar inflation, blindly investing in a broad basket of commodities may not be your best option. It pays to be choosy.
If your main investment goal is to protect against the dollar's devaluation, then opting for precious metals (namely, gold) over base metals, livestock and even lumber make a great deal of sense. But you can diversify that position somewhat with an appropriately weighted collection of precious metals, grains and softs (especially coffee) to help you achieve your goal.
Full Disclosure: As of writing, author is short March 2010 softwood lumber (LBH10).
